Generate code coverage reports and be able to comfortably and easily understand them is important for:
- Evaluate the quality of your test suite 📈
- Identify not tested source code 📝
- Provide guidance to your project 🔭
Generate code coverage reports
As explained in the previous post achieving code coverage reports in .NET core is possible with the responsibility of the open source, cross platform package Coverlet.
dotnet test
--no-build
--logger "trx;LogFileName=TestResults.trx"
--results-directory ./BuildReports/UnitTests/
/p:CollectCoverage=true
/p:CoverletOutput=./BuildReports/Coverage/
/p:CoverletOutputFormat=cobertura
The command above will create the TestResults.trx file using the Visual Studio logger and put those results in the defined results directory folder. Coverlet will make sure the coverage test data is collected, create the desired coverage folder and generate the data report in the cobertura specified format.
Publishing code coverage reports
Publishing your reports in a continuous integration flow is usually (depending on your infrastructure setup) as simple as adding a new task to your build script. Nowadays there are multiple web services and tooling that provide collecting, integration and tracking code coverage history: ReportGenerator, SonarCloud, Coveralls or Codecov are some examples available for use. Please note the mentioned web services such as the last three provide you free and paid account plans.
ReportGenerator
The previously generated data report should be easily interpreted, to achieve this I will use another great open-source tool: ReportGenerator
dotnet reportgenerator
-reports:/BuildReports/Coverage/coverage.cobertura.xml
-targetdir:BuildReports/Coverage/
-reporttypes:HTML;HTMLSummary
The command above will create a HTML report with a summary in human readable information based on the foregoing cobertura data file. The report files are generated in the defined targetdir folder. Report generator tool supports many input/output formats and report types.
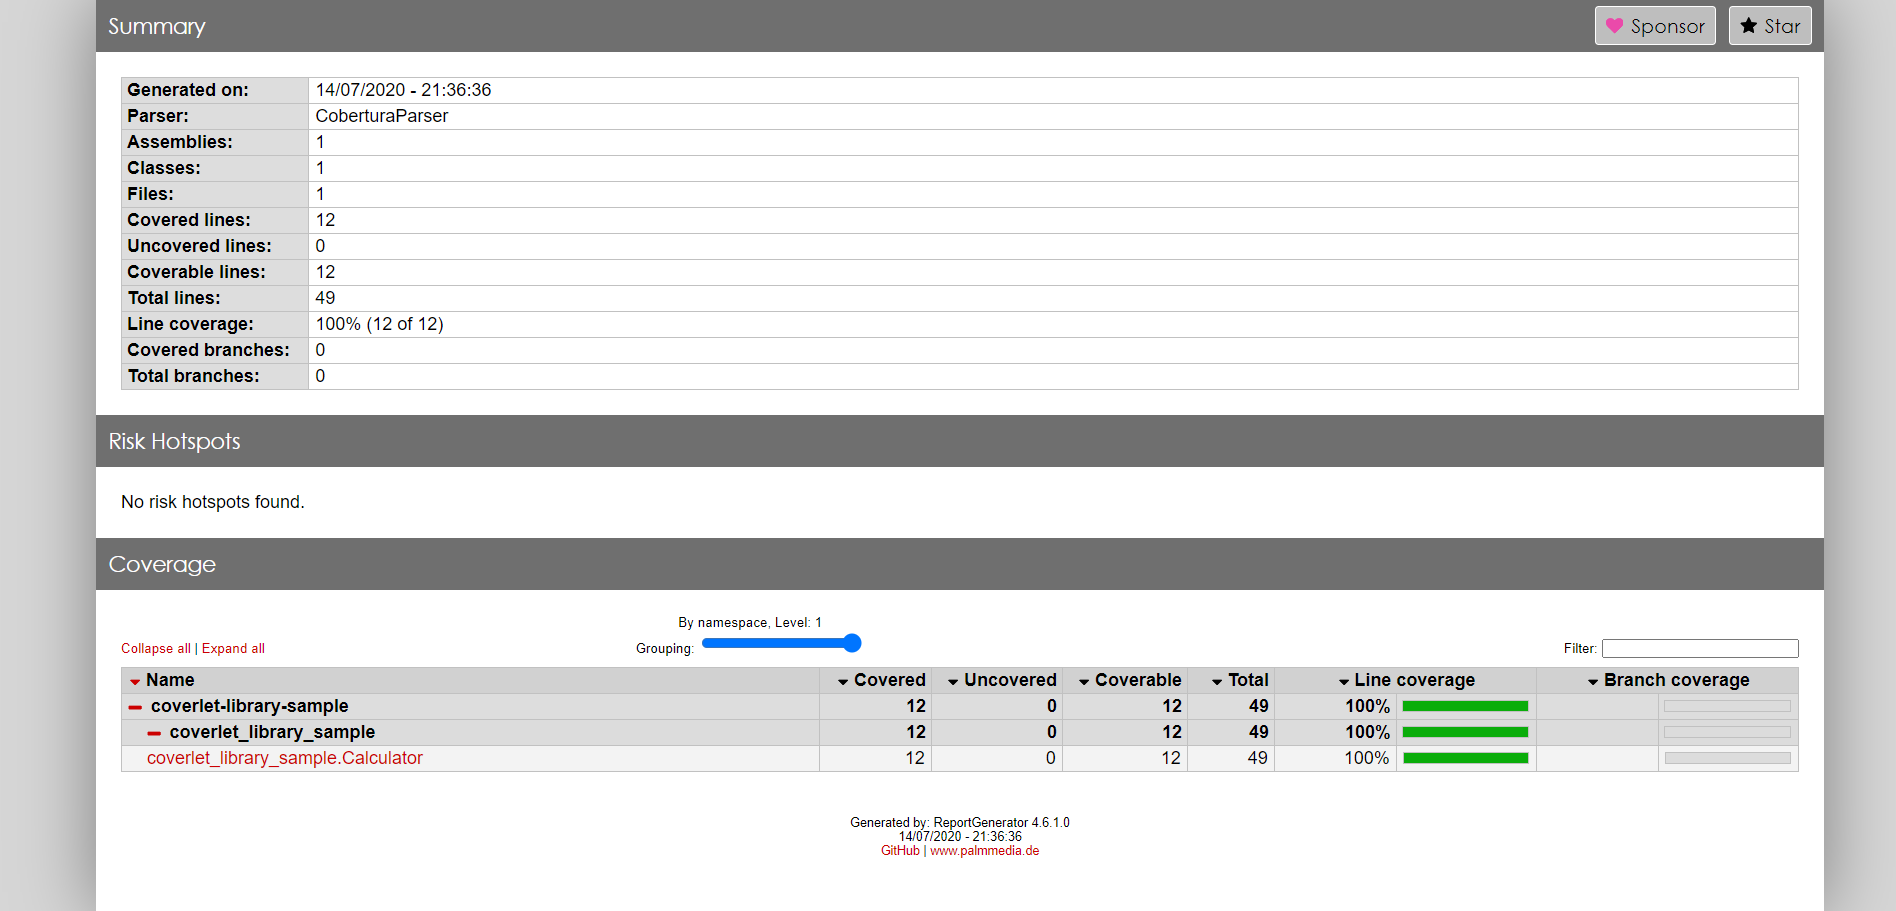
When opening the previously created summary report in your favourite browser you can already have an overview of all covered and uncovered lines or branches as well the number of assemblies, classes, lines and risk hotspots.

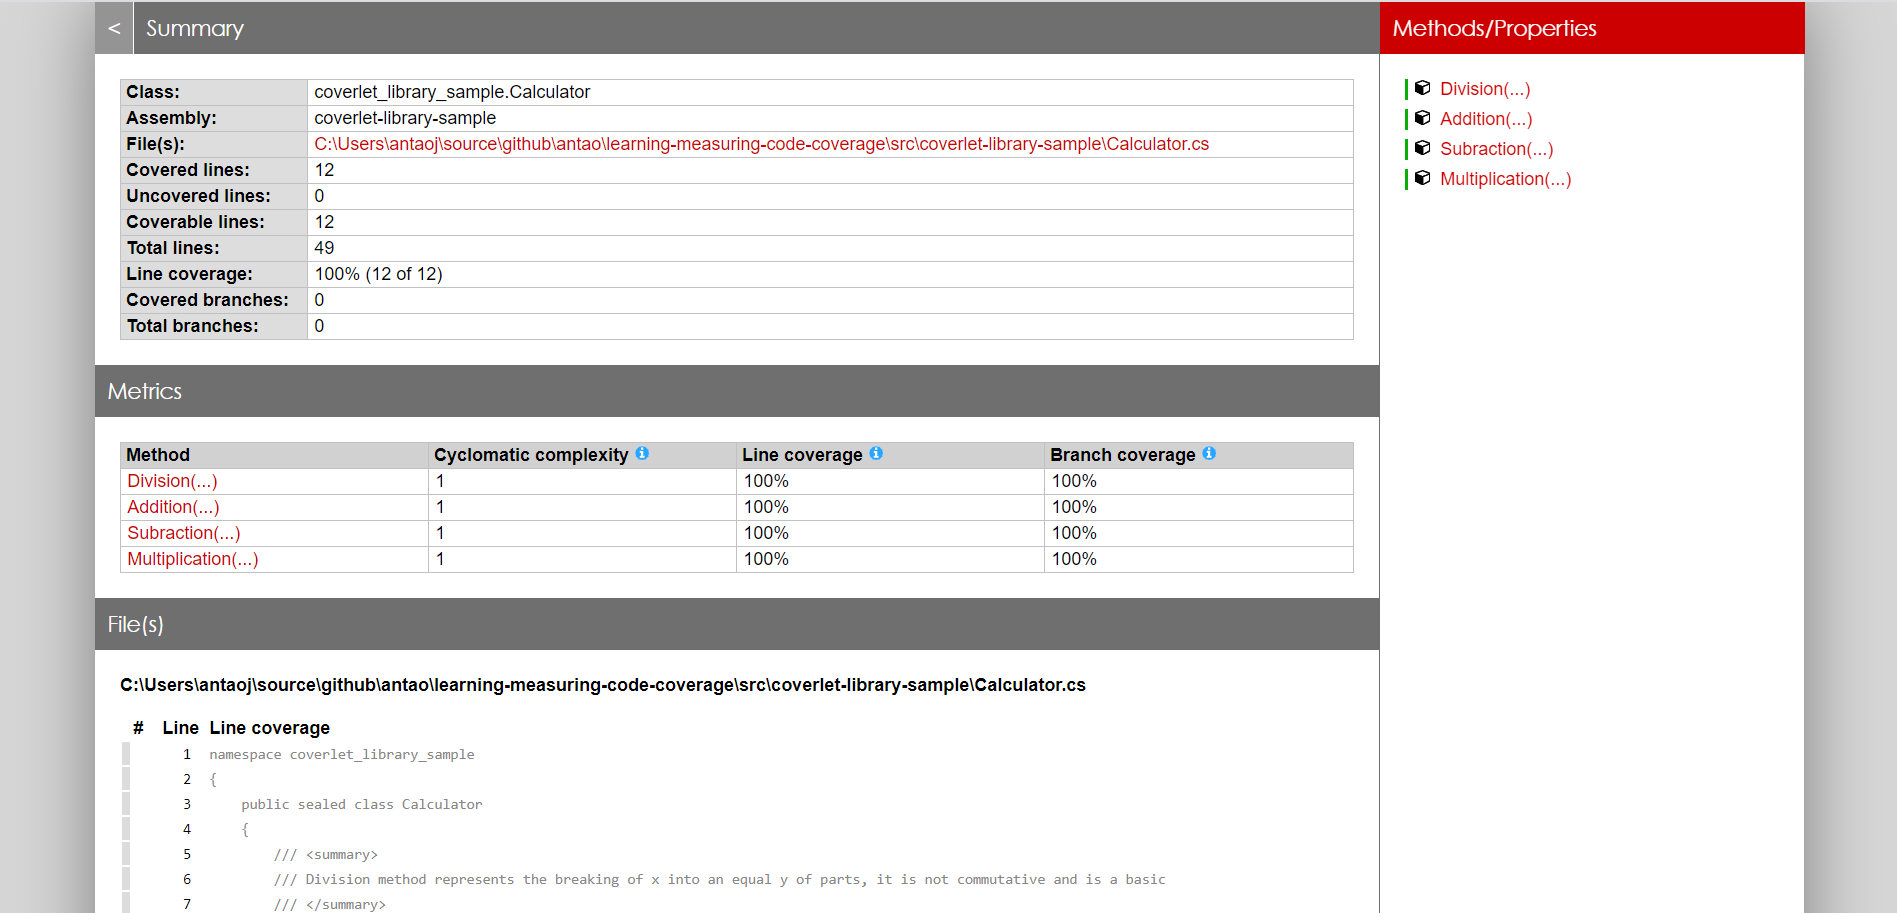
Furthermore is possible to navigate into classes and see coverage statistics about them. In the screenshot underneath you can see the exampleCalculator.cs class I’ve used in the sample test project to support this post. I personally find the methods/properties navigation bar displayed on the right side quite useful.

Coveralls
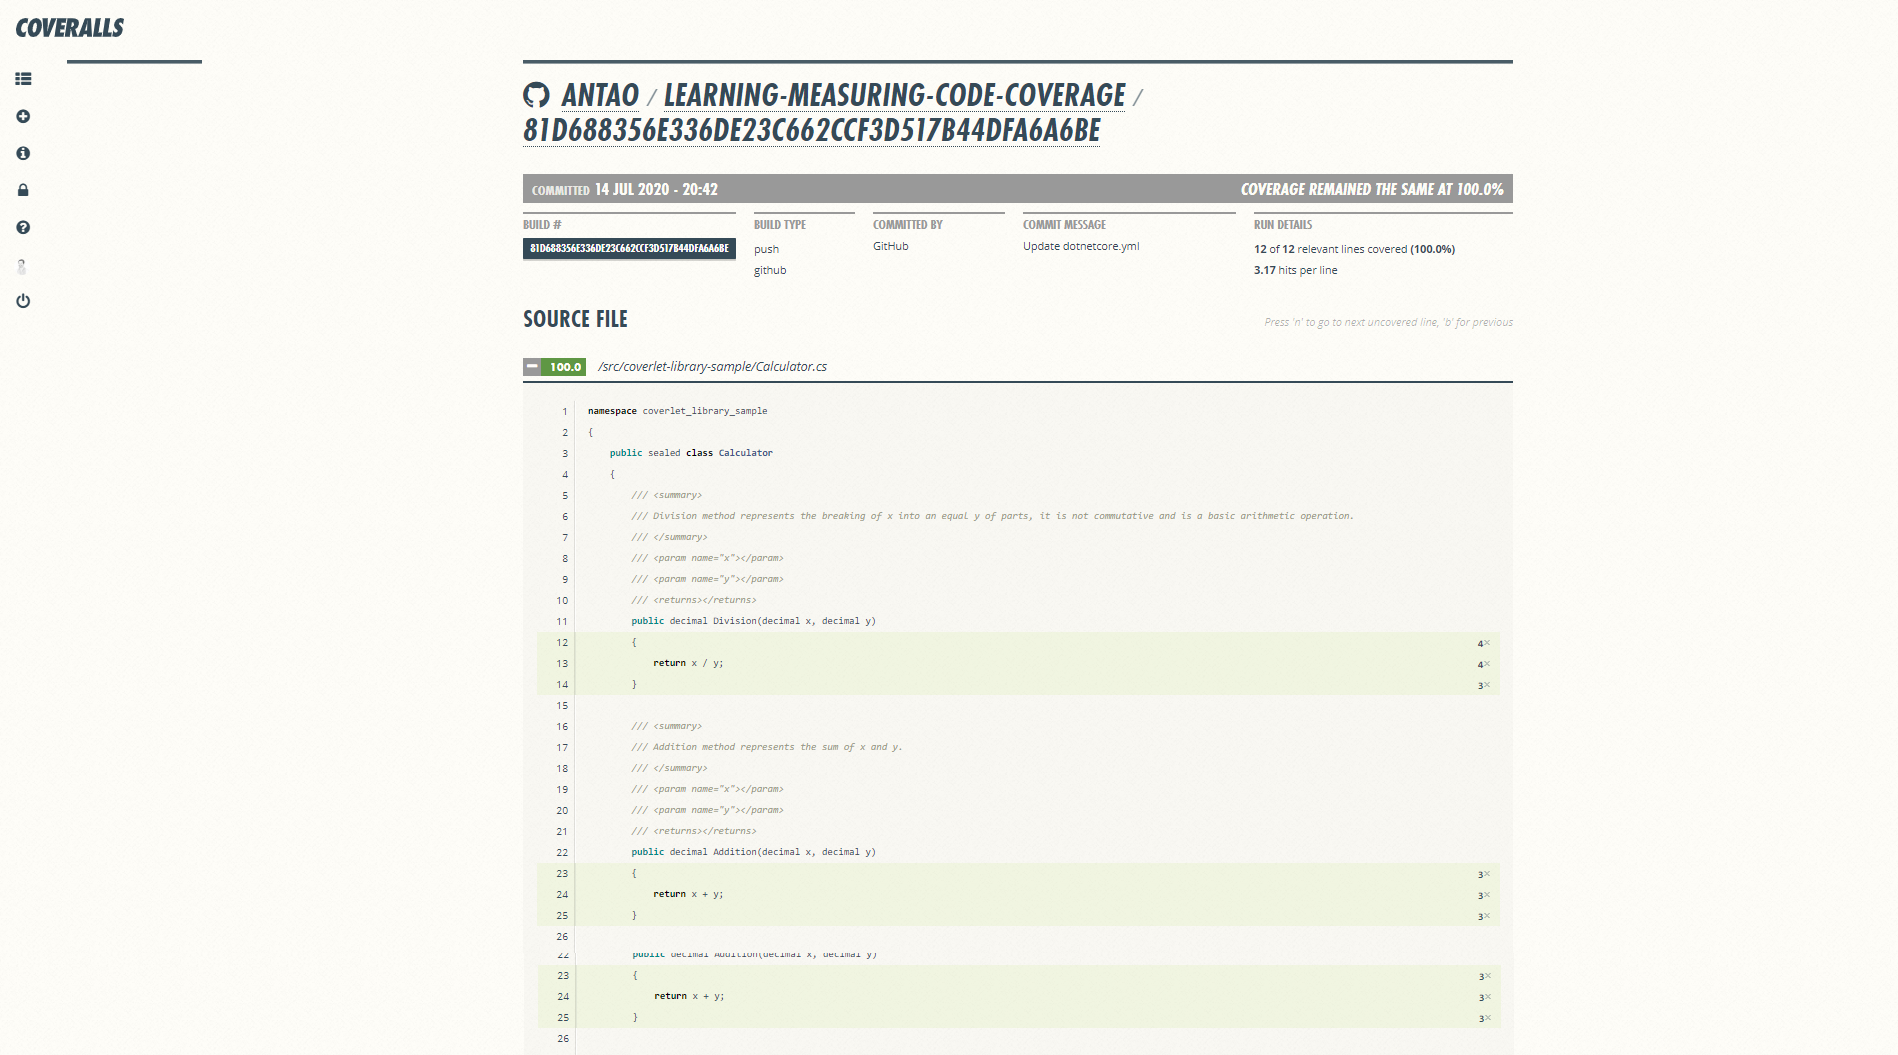
The process of publishing the coverage reports to Coveralls is quite simple. I’ve used the Coveralls GitHub Action since the sample test project I’ve wrote was already hosted in GitHub. The following code snippet action file performs a series of steps in which, the last, ‘Publish coverage report to coveralls.io’ enables the coverage report to be published in Coveralls. It relies on the GITHUB_TOKEN, which is available in GitHub Actions by default, no extra setup is needed for this. Also, the repository will be created in Coveralls automatically the first time the action is executed.

Once new features are added and are not covered they will be highlighted with a red colour. With Coveralls you can effortlessly view coverage rate changes on specific branches and commits.
Conclusion
Hopefully this blog posts are helpful for dotnet developers to measure their code coverage; Please consider sponsor or support projects like Coverlet or ReportGenerator if you are using them. Again, remember that good coverage does not mean good tests and aiming for a 100% coverage might turn to be costly; Identify, together with your team what are the critical parts of your application that require coverage.